Azure Monitor Application Insights: The Backbone of App Reliability in Azure
An Application Insights tutorial — from blind spots to full visibility.
Table of Contents
- Introduction
- What is Application Insights
- When & Why Use It
- Setup
- Pricing & Sampling
- Telemetry Types
- KQL Basics
- Integrations
- Best Practices
- Alerts
- Summary
📘 Introduction
Have you ever deployed an app that worked perfectly in dev… but once it hit production, users started complaining about random slowness, failed logins, “something feels off” or it takes “forever to load”. Without visibility, you’re left guessing. Is it the code? The database? The network?
That’s where Application Insights comes in.
Think of it as the black box recorder for your applications — it captures what’s happening inside your app (requests, dependencies, exceptions, user behavior) and gives you a real-time dashboard of its health.
Whether you’re running .NET, Java, Python, JavaScript, or even low-code platforms like Power Platform, Application Insights helps you:
- Detect issues before users notice
- Troubleshoot failures with full context
- Understand how people actually use your app
- Keep an eye on costs and performance trends
In short: from blind spots to full observability, Application Insights is the backbone of app reliability on Azure.
🔍 What is Application Insights?
Application Insights is a powerful, extensible application performance monitoring (APM) service within the Azure Monitor suite. It helps developers, architects, and operations teams detect anomalies, monitor usage, analyze performance, and diagnose failures across web apps, APIs, background services, and cloud-native applications.
Whether you’re running .NET, Java, Python, JavaScript, or low-code platforms like Power Platform, App Insights is your gateway to real-time observability.
🏠 When & Why Should You Use Application Insights
Every app tells a story, but without the right tools, that story stays hidden.
Application Insights helps you uncover what’s really happening in production, not just what your test cases predicted.
You should use it when you want to:
- Monitor production apps across environments without babysitting servers
- Catch failures in the act with full stack traces (no more “works on my machine”)
- Visualize performance trends to see where bottlenecks creep in
- Understand user behavior — who’s using which feature, how often, and where they drop off
- Stay ahead of incidents with proactive anomaly alerts
Think about enterprise scenarios:
- A banking app that needs to meet SLAs by spotting transaction delays instantly
- A retail platform watching customer journeys to prevent cart abandonment
- An internal HR portal where one hidden error could block thousands of employees
- An approval that is stuck forever and user has no clue
If reliability, performance, and user trust matter, Application Insights isn’t just nice to have — it’s your safety net.
🧭 How to Set Up Application Insights
Getting started with Azure Monitor Application Insights setup is surprisingly quick, you can go from zero to live telemetry in just a few clicks (or a few lines of code if you’re into automation).
1. Azure Portal (the fast way)
- Head over to the Azure Portal and search for Application Insights.
- Click Create and fill in the basics:
- Subscription & Resource Group
- A friendly name and the region closest to your users
- Choose Workspace-based mode (recommended for governance and KQL goodness)
- Hit Create, wait a minute, and you’ve got your Insights resource.
- Grab the Connection String and plug it into your app — that’s the key that unlocks telemetry.
💡 Tip: If you’re just experimenting, start with the portal. It’s quick and gives you immediate results.
2. Infrastructure as Code (the scalable way)
If you’re the type who prefers repeatability and automation, you can provision App Insights using Azure CLI, Bicep, or ARM templates.
Here’s a simple CLI example:
az monitor app-insights component create \
  --app MyAppInsights \
  --location eastus \
  --resource-group MyResourceGroup \
  --workspace MyLogAnalyticsWorkspace \
  --kind web
💡 Tip: This approach shines when you’re rolling out Insights across multiple environments (Dev, Test, Prod) with the same settings.
💸 Understanding Pricing & Sampling
Application Insights works on a pay-as-you-go model.
Think of it like your phone data plan: the more telemetry (logs, traces, requests) you send in, the more you pay.
How Pricing Works
- Data Ingestion → You’re billed per GB of telemetry ingested.
- Retention → The first 90 days are free. Need to keep data longer? That comes with a cost.
- Extra Features → Things like multi-step web tests or exporting to Event Hub can add to your bill.
💡 Pro tip: Don’t just “log everything and hope for the best.” Observability is powerful, but it can also get expensive if you’re not intentional.
Sampling: Your Cost-Saving Superpower
This is where sampling comes in. Instead of sending every single event, you can trim down what’s sent while still keeping an accurate picture.
- Fixed-Rate Sampling → Randomly drops events at a set percentage.
Good for steady traffic. - Adaptive Sampling → Automatically adjusts based on load.
Great for apps with traffic spikes. - Server-Side or SDK-Based → You decide whether to sample data at the source (inside your app) or centrally.
💡 Think of sampling like watching a sports match — you don’t need every single frame to understand the game. A highlight reel is enough to know who scored and when.
🔍 Always keep an eye on two numbers:
- Ingestion volume (how much data you’re sending in)
- Retention policy (how long you’re keeping it)
Together, they decide your monthly bill.
Sampling to Control Cost
- Fixed-Rate Sampling: Drops random events
- Adaptive Sampling: Dynamically adjusts based on volume
- Server-Side or SDK-Based: You can apply sampling at the source
🔍 Tip: Always monitor ingestion vs. retention to avoid surprises.
🔄 What Telemetry Can You Collect?
Once your app is wired up, Application Insights becomes a stream of signals about what’s happening inside.
Here are the main types of telemetry — and how they help you in real life:
| Type | What it means | Why it matters |
|---|---|---|
| Requests | Every incoming HTTP call to your app or API. | Spot traffic patterns and slow endpoints. Example: Your /checkout API suddenly takes 5s instead of 500ms. |
| Dependencies | Outbound calls your app makes (SQL queries, REST APIs, Azure services). | See if your app is slow because you’re waiting on someone else. |
| Exceptions | Captured errors, stack traces, and unhandled exceptions. | Pinpoint exactly what failed and where in the code. |
| Traces | Developer-defined logs (Debug, Info, Warn). | Add context like “Order validation started” to trace the story of a request. |
| Page Views | For frontend apps (React, Angular, Vue, etc.). | Understand which pages users actually visit, and how long they stay. |
| Custom Events | Your own named events and metrics. | Track business actions, like “PaymentFailed” or “UserSignedUp”. |
💡 Think of telemetry like pieces of a puzzle: requests tell you what happened, dependencies tell you who was involved, exceptions explain why it failed, and traces fill in the story in between.
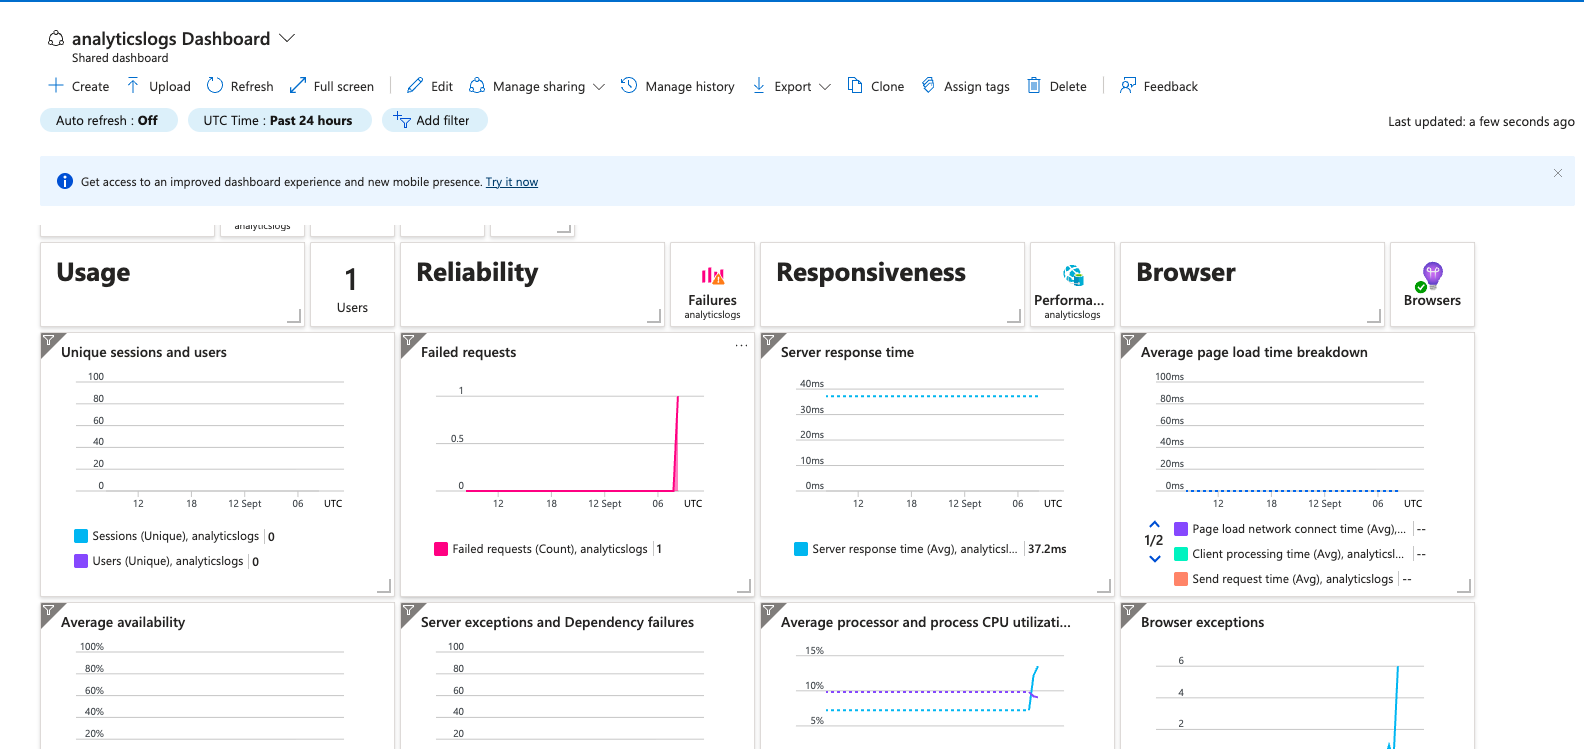
Example
The below example is an overview of how my bot is performing after connecting to the application insights in an hour
📑 Getting Started with Kusto Query Language (KQL) in Application Insights
Telemetry is only as powerful as the questions you can ask from it — and that’s where KQL (Kusto Query Language) shines.
If SQL is how you talk to databases, KQL is how you talk to your logs.
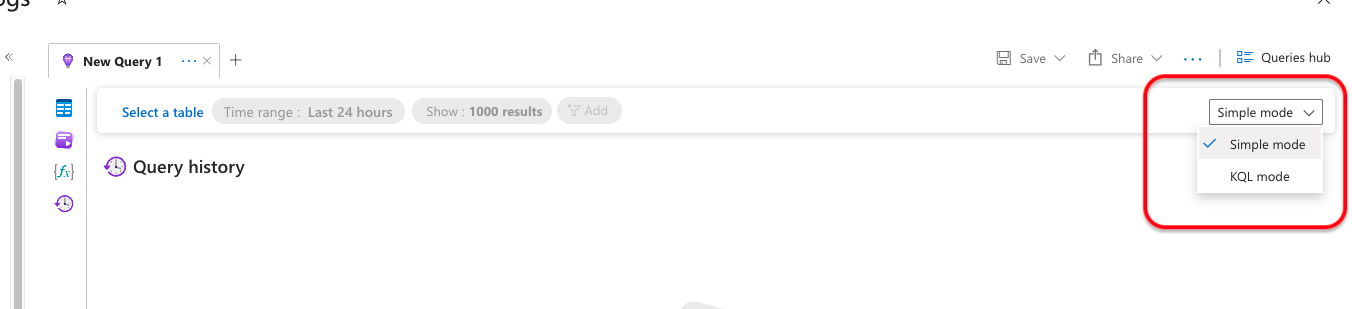
Once your data starts flowing in, head to your Application Insights resource → Logs.
Switch to KQL mode, and you’re ready to start querying.
Example 1: Count failed requests in the past hour
requests
| where success == false and timestamp > ago(1h)
| summarize failures = count() by operation_Name
Example 2: Top 5 slowest dependencies
dependencies
| summarize avg(duration) by target
| top 5 by avg_duration
Example 3: Recent custom events
events
| where timestamp > ago(30m)
| project name, customDimensions
💡 Pro tip: Don’t just run queries manually — you can save them as dashboards, pin them to Azure Workbooks, or even pipe them into Power BI for rich visualizations.
You can also embed KQL dashboards in Power BI, automate via REST API, or query from Azure Workbooks.
🔁 Integration Touchpoints
Application Insights isn’t just a standalone dashboard — it plugs into the tools and platforms you already use every day.
Here are some of the most common (and powerful) integration points:
-
Azure Functions, Web Apps, AKS
Instrument your backend services directly with SDKs and get real-time performance and failure telemetry. -
Power Platform
Capture logs from Power Automate flows or custom connectors, so even low-code apps have full observability. -
Azure OpenAI & Copilot Studio
Feed your telemetry into AI to generate natural language summaries of issues or to create copilots that answer “What’s wrong with my app right now?” -
DevOps Pipelines (Azure DevOps, GitHub Actions)
Surface alerts during CI/CD so you know if a new deployment slowed things down. -
SPFx (SharePoint Framework)
Add client-side logging with PnP Logging + App Insights, so you know what’s happening in your custom web parts.
💡 Think of integrations like power plugs: wherever your app runs or your team works, Application Insights has a socket to fit right in.
💡 Best Practices for Enterprise Usage
Here are some proven Azure Application Insights best practices for enterprise teams
- Use workspace-based App Insights for central governance
- Set up Log Alerts on performance or error thresholds
- Standardize customDimensions for traceability (e.g., FlowName, UserID, AppRegion)
- Archive or export data older than 90 days to Blob Storage or Event Hub
- Define naming conventions for events and metrics across apps
🔔 Setting Up Alerts
Collecting telemetry is only half the battle — the real win is knowing when something needs your attention.
That’s where alerts come in.
Think of alerts as your app’s early warning system. Instead of waiting for a user to raise a ticket, Azure can tap you on the shoulder the moment failures spike, performance dips, or availability drops.
The key is balance: too few alerts and you’ll miss issues, too many and your team will start ignoring them. The goal is to set up the right alerts, routed to the right people, at the right time.
It’s equally important to have right kind of alerts to act upon the issues immediately to the right team. Setting up of Alerts helps us
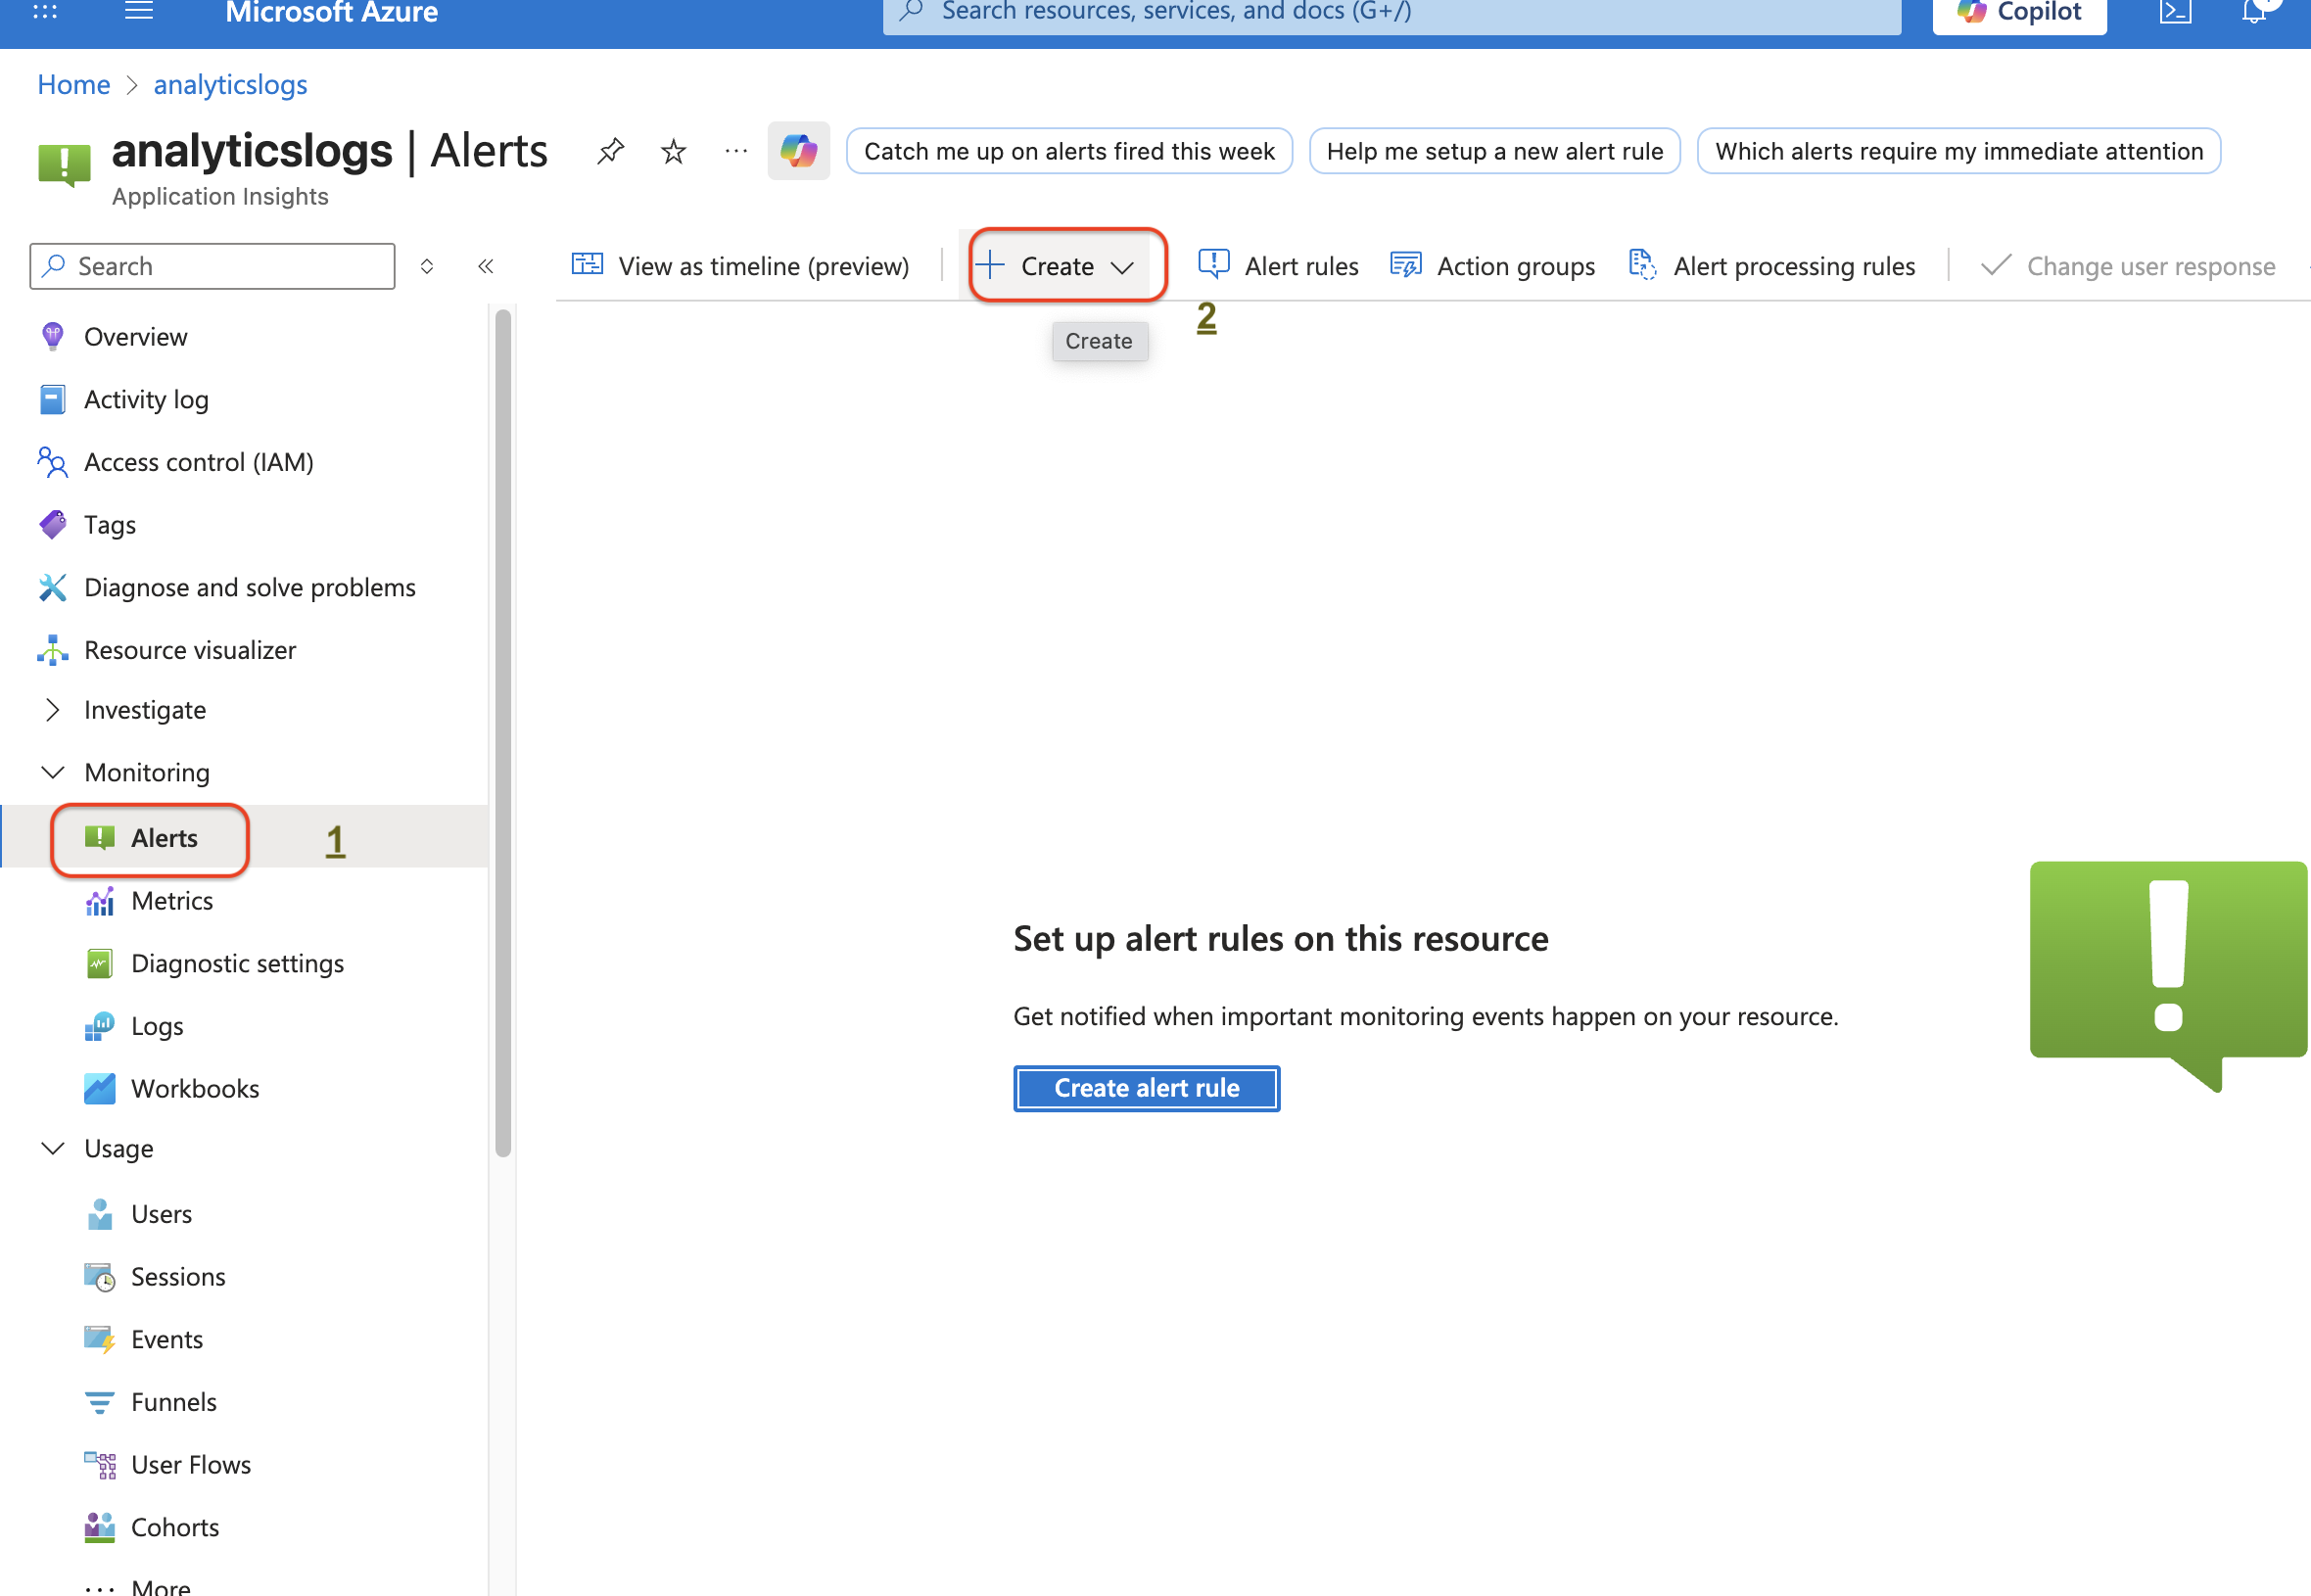 1. Go to your Application Insights resource.
2. In the left-hand menu, select Alerts → Create → Alert rule.
1. Go to your Application Insights resource.
2. In the left-hand menu, select Alerts → Create → Alert rule.
1. Fill in the details:
- Scope → Your App Insights resource.
- Condition → Define what metric or query should trigger the alert (e.g., failed requests > 5 in 5 minutes).
- Action group → Who should get notified (email, Teams, webhook, Logic App, etc.).
- Alert rule details → Name, severity (0 = Sev1, 4 = Sev5), enable/disable.
2. Save → Azure will start evaluating your telemetry against that condition.
🔔 Setting Up Alerts in Application Insights
Alert Rule
- Defines what to watch and when to trigger.
- You specify the scope (App Insights resource), the condition (e.g., failed requests > 5 in 5 min), and link it to an action group.
- Think of it as the “if condition” part of monitoring.
📡 Signals in Alert Rules
Signals define what telemetry to monitor. When creating an alert rule, you choose a signal that represents the condition you want to track.
Common Signals
-
Availability → Results from synthetic availability tests (ping tests, multi-step tests).
Example: Alert if availability < 99% in the last 5 minutes. -
Failed Requests → Total number of requests marked as unsuccessful (
success == false).
Example: Alert if failed requests > 50 in 10 minutes. -
Exceptions → Number of exceptions captured by the App Insights SDK.
Example: Alert ifSqlExceptionoccurs more than 100 times in 15 minutes. -
Server Response Time → Latency of incoming requests.
Example: Alert if average response time > 2 seconds. -
Server Exceptions → Specifically server-side exceptions.
Example: Alert when backend errors suddenly spike. -
Custom Log Search → A KQL-based condition to monitor any telemetry type.
Example: Alert if custom eventPaymentFailedoccurs more than 5 times in 15 minutes.
🧩 Dimension Options
Dimensions allow you to split or filter telemetry so alerts are more precise. Instead of alerting on all requests, you can scope alerts to specific conditions.
-
Request performance → Group by fast vs. slow requests.
Example: Alert only on slow requests > 2 seconds. -
Result code → Group by HTTP status codes (200, 404, 500, etc.).
Example: Alert only on 5xx server errors, ignore 4xx client errors. -
Is traffic synthetic → Distinguish between real traffic and synthetic availability tests.
Example: Ignore synthetic failures, alert only on real traffic issues. -
Cloud role instance → The specific instance of your app/service (VM, App Service instance, AKS pod).
Example: Alert if Instance-3 is unhealthy, not the whole app. -
Cloud role name → Logical role name of the app/service (e.g., Checkout API, Frontend WebApp).
Example: Alert if Checkout API fails, ignore marketing site errors.
⏱️ When to Evaluate (Frequency)
This setting defines how often Azure checks if the alert condition has been met.
- Check every → The frequency of evaluation (e.g., every 1 minute, every 5 minutes).
- Impact: Smaller intervals = faster detection, but more cost and noise.
Example: Check every 1 minute → alerts fire almost instantly.
🔄 Lookback Period
The lookback period defines how far back Azure looks when checking data during each evaluation.
- Example:
- Check every: 1 minute
- Lookback period: 5 minutes
- Meaning → Every 1 minute, Azure checks the last 5 minutes of telemetry for breaches.
Benefit: Prevents missing short-lived spikes between evaluation intervals.
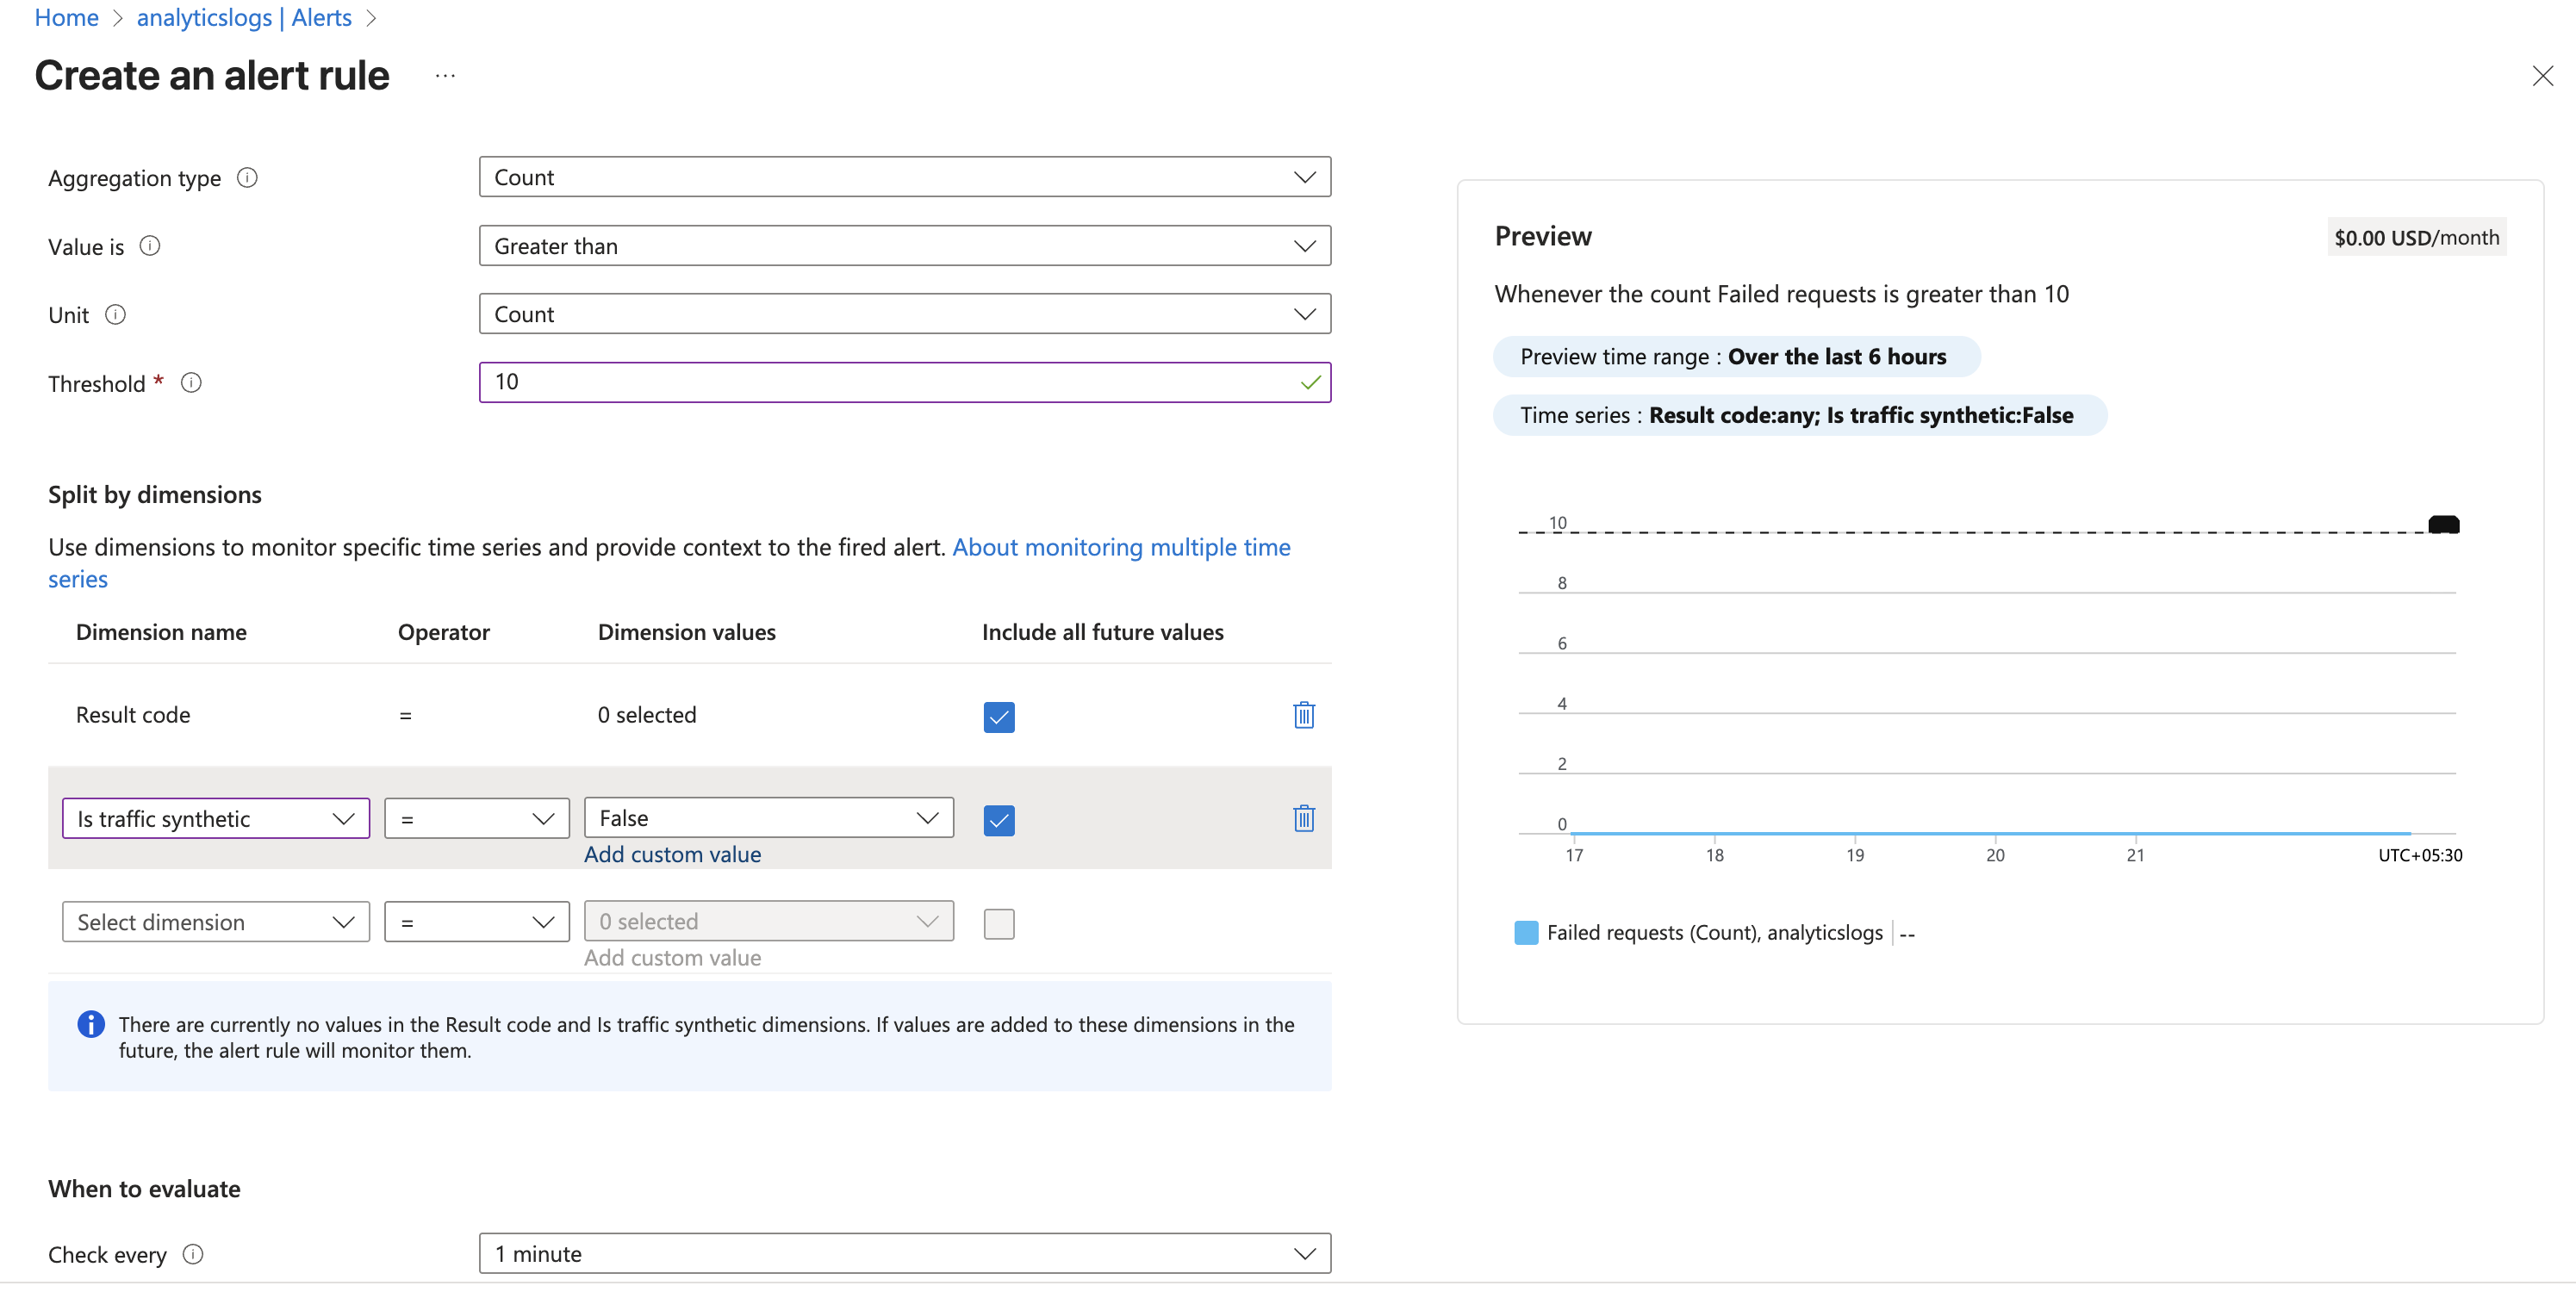
📑 Putting It All Together
- Choose a Signal → e.g., Failed Requests.
- Define Alert Logic → Threshold > 10.
- Set Dimensions → e.g., only for Result Code 500.
- Configure Evaluation → Check every 1 minute, lookback 5 minutes.
- Link Action Group → Who should get notified (email, Teams, webhook).
The below figure shows I have applied alerts on non synthetic data when failure count is greater than 10 and if failed requests > 5 in the last 5 minutes → the alert will fire. • Azure checks this every 1 minute, so you get near real-time detection.
2. Action Group
- Defines what happens after an alert fires.
- Can include:
- Email / SMS / Push notifications
- Azure Apps (Logic Apps, Functions, Automation Runbooks)
- ITSM integrations (ServiceNow, PagerDuty, Teams webhook, etc.)
- Reusable across multiple alerts.
3. Alert Processing Rule
- Controls how alerts are handled after firing.
- Useful for:
- Suppressing alerts during planned maintenance
- Changing severity dynamically
- Routing alerts differently (e.g., business hours vs. after-hours)
- Think of it as the “filter and route” layer for your alerts.
👉 Quick Analogy
- Alert Rule = “When to ring the bell”
- Action Group = “Who hears the bell”
- Alert Processing Rule = “How the bell is handled (mute, reroute, change tone)”
📝 Summary
Application Insights offers a robust foundation for observability in modern apps. Whether you’re instrumenting a Power App, a .NET API, or a multi-region commerce platform, it gives you the power to detect, diagnose, and drive continuous improvement.
In the next post, we’ll explore how to use Application Insights to monitor Power Automate flows and low-code apps, using real-time telemetry and automated remediation.
📅 Stay tuned for: “Enabling Logging with Application Insights in Power Automate (Part 2)”
Subscribe via RSS
Comments